I’ve been struggling with a problem for more than a year and would be extremely grateful if someone could assist me in resolving it.
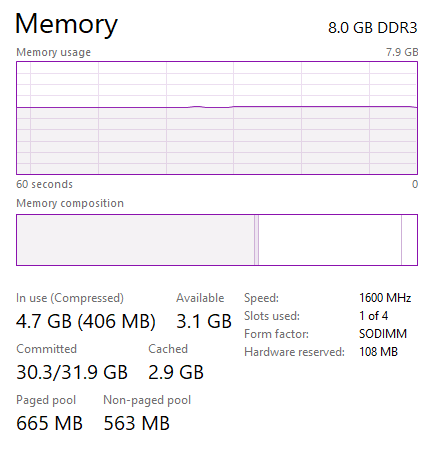
Whenever I use my laptop with 8GB of physical memory for an extended period of time, it eventually stops working due to running out of memory, resulting in various memory-related errors. Strangely enough, the percentage of memory usage displayed in the task manager never changes, which has always perplexed me.
However, after recently studying virtual memory, I discovered that my laptop has a total of 32GB, as indicated by the “Committed” Memory. At this very moment, I’m experiencing a memory issue and have closed all applications to type this message. The committed memory usage is currently 30.2/31.9GB, which, if I’m correct, is the amount of space that processes have reserved to operate.
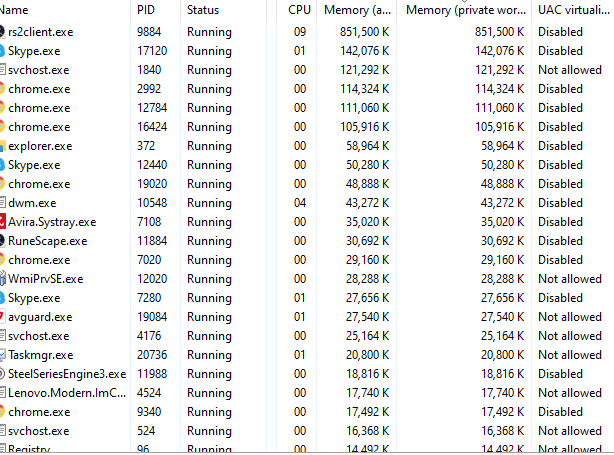
I’ve checked the Resource Monitor and summed up all the values in the Commit (KB) column, which only adds up to around 6GB, leaving me baffled as to what’s causing the problem. Could it be an application with a memory leak?
I’m not sure where to start, so I’ve included some screenshots and welcome any questions or advice.

Resource manager sorted by commit:

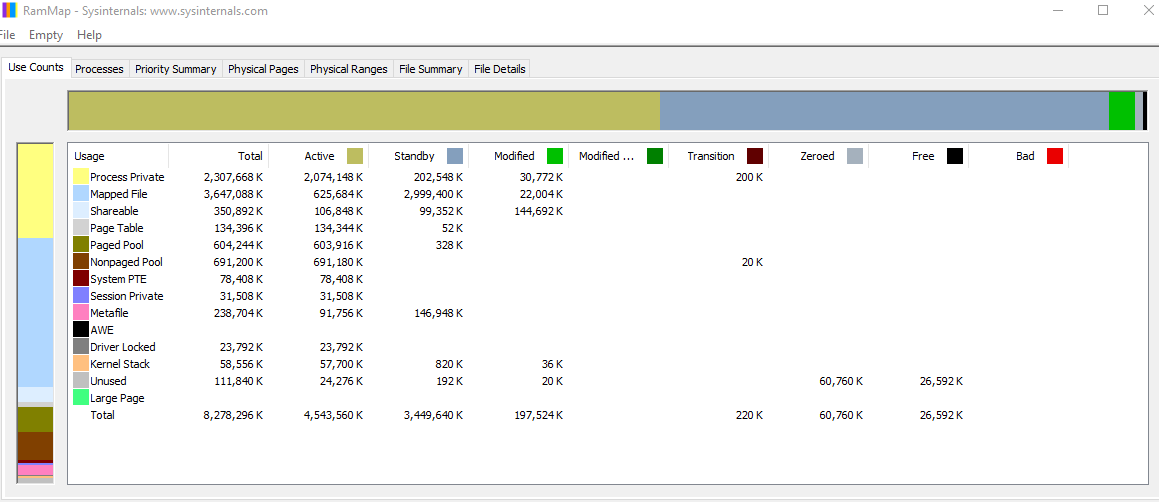
I have installed RamMap and these numbers are what I see, but they don’t appear to total up to 30 gigabytes. What specific information should I be searching for?


3 Answers
Understanding Committed Memory and Memory Leaks
If you have been experiencing memory issues on your laptop, you may have noticed that the percentage of memory usage displayed in the task manager never changes, even when you are running multiple applications. This can be confusing and frustrating, but it is actually a result of how virtual memory works.
Virtual memory is a technique used by operating systems to expand the amount of available memory in a computer. When physical memory (RAM) is running low, the operating system can use a portion of the hard drive to create a page file, which acts as an extension of physical memory. This allows the computer to continue running without running out of memory.
Committed memory refers to the amount of virtual memory that has been reserved by running processes. This includes both the physical memory and the page file. When a process requests memory, the operating system reserves a portion of the page file for that process. This reserved memory is considered part of the committed memory.
The committed memory can continue to grow even if the physical memory usage remains constant. This is because processes are reserving more virtual memory than they are actually using. This can happen if a process has a memory leak, which is a bug that causes the process to continue reserving memory even after it is no longer needed.
To troubleshoot memory issues on your laptop, you can use the Resource Monitor and RamMap tools to identify which processes are using the most memory and how much memory they have reserved. You can also monitor the committed memory usage over time to see if it is growing even when physical memory usage is low.
If you suspect that a process has a memory leak, you can try closing the process and restarting it to see if the memory usage decreases. You can also check for updates or patches for the application to see if the issue has been fixed.
Using Resource Monitor to Monitor Memory Usage
Resource Monitor is a built-in tool in Windows that allows you to monitor the performance of your computer, including memory usage. To open Resource Monitor, follow these steps:
1. Press the Windows key + R to open the Run dialog box.
2. Type “resmon” and press Enter.
3. Click on the Memory tab to view information about memory usage.
On the Memory tab, you can view the following information:
– Total: The total amount of physical memory installed on your computer.
– Cached: The amount of memory used for caching data from the hard drive.
– Available: The amount of memory that is currently available for use by processes.
– Free: The amount of memory that is not being used.
– Modified: The amount of memory that is being used by the operating system and cannot be used by processes.
– Standby: The amount of memory that is available for use by processes if needed.
– In Use: The amount of memory that is currently being used by processes.
– Hard Faults/sec: The number of times per second that the operating system has to read data from the hard drive instead of from memory.
You can sort the processes by different columns by clicking on the column header. For example, you can sort by Commit (KB) to see which processes have reserved the most memory.
Using RamMap to Troubleshoot Memory Issues
RamMap is a free tool from Microsoft that allows you to view detailed information about memory usage on your computer. To use RamMap, follow these steps:
1. Download and install RamMap from the Microsoft website.
2. Open RamMap and click on the Use Counts tab.
On the Use Counts tab, you can view the following information:
– Physical Memory: The amount of physical memory installed on your computer.
– Page Table: The amount of memory used by the operating system to keep track of virtual memory.
– Nonpaged Pool: The amount of memory used by the operating system for kernel-mode drivers and kernel-resident data.
– Paged Pool: The amount of memory used by the operating system for user-mode drivers and system code.
– Commit: The amount of virtual memory that has been reserved by running processes.
– Mapped File: The amount of memory used by mapped files, such as DLLs and EXEs.
– Driver Locked: The amount of memory used by drivers that cannot be paged out.
– Process Private: The amount of memory used by processes that cannot be shared with other processes.
You can click on any of these categories to view a list of processes and how much memory they are using. You can also click on the Processes tab to view information about individual processes, including how much memory they have reserved and how much they are actually using.
Troubleshooting Memory Leaks
If you suspect that a process has a memory leak, there are several steps you can take to troubleshoot the issue.
1. Identify the process: Use Resource Monitor or RamMap to identify which process is using the most memory and how much memory it has reserved.
2. Restart the process: Try closing the process and restarting it to see if the memory usage decreases.
3. Check for updates: Check for updates or patches for the application to see if the issue has been fixed.
4. Disable add-ons: If the process is a web browser, try disabling any add-ons or extensions that may be causing the issue.
5. Run a virus scan: Run a virus scan to check for any malware that may be causing the issue.
6. Reinstall the application: If all else fails, try uninstalling and reinstalling the application to see if the issue is resolved.
Preventing Memory Issues
To prevent memory issues on your laptop, there are several steps you can take.
1. Upgrade your RAM: If your laptop is running low on physical memory, consider upgrading to a higher capacity RAM.
2. Close unused applications: Make sure to close any applications that you are not using to free up memory.
3. Disable startup programs: Disable any programs that start automatically when you log in to your computer to free up memory.
4. Clear your cache: Clear your browser cache and temporary files to free up memory.
5. Use a memory optimizer: Use a memory optimizer tool to automatically free up memory when it is running low.
6. Monitor your memory usage: Keep an eye on your memory usage using Resource Monitor or RamMap to identify any issues before they become a problem.
Conclusion
Memory issues can be frustrating and can cause your computer to slow down or stop working altogether. By understanding how virtual memory works and using tools like Resource Monitor and RamMap, you can troubleshoot memory issues and prevent them from happening in the future. Remember to keep an eye on your memory usage and take action if you notice any issues.
It sounds like you are experiencing a problem with your computer’s memory usage. When you say that the “Committed” memory is 30.2/31.9 GB, do you mean that the total amount of memory that has been reserved by processes is around 30 GB? If that’s the case, it’s normal for the “Committed” memory to be higher than the physical memory (RAM) installed on your system, because Windows uses a feature called “virtual memory” to allow programs to use more memory than is physically available.
To troubleshoot this issue, you can try the following steps:
- Check for any programs or processes that are using a large amount of memory. You can do this by opening Task Manager (Ctrl+Alt+Delete) and sorting the processes by memory usage. If you see any program or process that is using an unusually large amount of memory, you can try closing it or uninstalling it to see if that helps.
- Check for any memory leaks. A memory leak is a situation where a program or process continually allocates memory, but never releases it, causing the amount of available memory to gradually decrease over time. To check for memory leaks, you can try using a tool like Windows Performance Monitor or a third-party utility like Process Hacker.
- Make sure that you have enough virtual memory available. Virtual memory is a feature of the operating system that allows it to use hard disk space as additional memory when the physical RAM is full. You can check your virtual memory settings by going to Control Panel > System > Advanced system settings > Advanced tab > Performance settings > Advanced tab > Virtual memory. Make sure that the “Total paging file size for all drives” is set to a value that is at least 1.5 times the amount of physical memory on your system.
- Check for malware or other security threats. Sometimes, malware or other security threats can cause high memory usage by consuming large amounts of memory or by causing memory leaks. You can scan your system for malware using a reputable antivirus or anti-malware program.
I hope these suggestions help. If you continue to have problems with your computer’s memory usage, it may be helpful to gather more information, such as a list of running processes and their memory usage, and post it here for further analysis.
I experimented with several applications but none of them revealed the memory usage of each individual process. Ultimately, I accessed the “Startup” tab in the task manager and deactivated any unnecessary programs while taking note of the ones I disabled, so I could enable them later if needed.
This solved the issue; I’m unsure which process was causing the problem, but the memory leak is now resolved.